There has been a Short Term Reversal from recent lows in last couple of weeks. Prices have overcome the Resistances and Gaps to Trade firm. Is it a complete Reversal making the bias Up or is it a Reaction before the Fall follows again ? Let us objectively analyze and try to find a ' Method in the Madness' with help of the Technicals and combination of them -
1. Indicators :
The Weekly Indicators are nearing Overbought conditions but yet to show weakness or Sell signal . Prices have closed above mid Bollinger band .
The Daily chart shows a similar trait with Indicators Overbought and yet to give a Sell signal and now trading above Top B.B.
The Trend is firm and is likely to continue till the Sell signal comes after exhausting in Overbought zone.
2. Trendlines and Patterns :
The corrective phase since Nov '10 can be seen as trading in a Channel . Prices are approaching the Top Trendline near apprx. 5450-60 level.
An Island Reversal Pattern is formed where the gap prices of apprx. 5230-5325 seperates the lower portion of the trade in Daily charts. This is a Bullish Pattern but with worst performance rank and reliability. The Price Objective of this pattern is apprx. 5580 taking in the performance percentage. Throw back to the breakout level ,here apprx. 5220 , is normal.
Another Pattern discussed in one of the previous post is of a Head and Shoulders in the Weekly chart. The retrace seems to be on to test the Neckline near 5500 level.
3. Moving Averages :
The Medium to Long Term Moving Averages of 50, 100, 200 dma are all Bearishly aligned as of now, with Prices approaching 200dma at apprx. 5410 level.
Moving Averages are Lagging Indicators and will give confirmation only after a lag of time even if its a reversal here.
4. India -VIX :
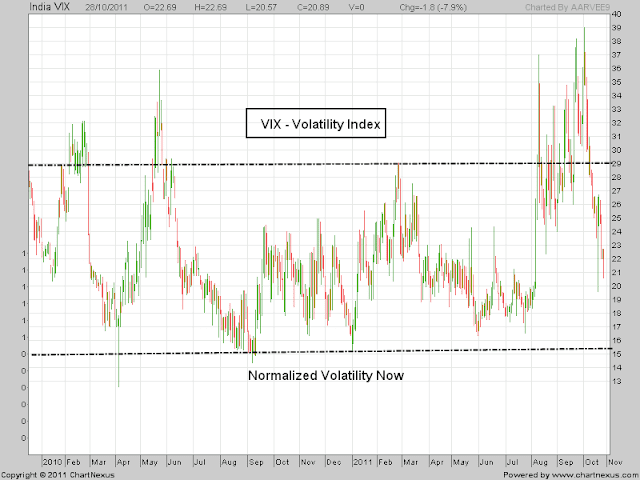
The Volatility Index or the VIX chart shows the cooling of the volatility which was built in since Aug. series and now within the range.
It indicates traders comfort and confidence and is a Bullish signal.
5. Option Analysis :
Its the start of the Nov. series and data may not be too confirming but is shows a probable Resistance in 5400-5500 zone and a Support in 4900-5000 level by the built up of Open Interest data. It will change as we go ahead.
6. Volume Profile :
A 10d Profile for near term shows a Support at 5100. Upward bias continues above it .
Though I don't have the relevant chart but One year Profile POC comes at apprx. 5480 level. This may be the SAR level for trading the Short term Positionals.
7. FII Data :
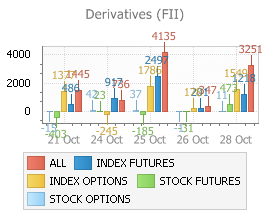
There has been a Huge Buying from FII's in Both Cash and Derivatives segment which cautions us against any proactive Bearish stance.
8. Elliott Wave Analysis :
Frankly EW counts are not so clear at this point of time. Even though my Preferred Count has not been invalidated , where the Point of Invalidation comes at 5496 , I still prefer to adjust it seeing the Wave personality and Indicators I follow in conjuction with EW . One may check the Last Update - Click Here
Now I propose a minor change in the subwave count and the overall Corrective Structure since Nov '10. A complex correction was on in a Double Zigzag Pattern ,
W-X-Y, since then. But seeing the wave structure since recent lows of 4728 , I mark the end of the Double Zigzag at 4728 and now an Intermediate wave , XX, going on. This will further lead to another leg of correction which will then form a Triple Zigzag Pattern, W-X-Y-XX-Z . A simple Line Diagram of this Pattern may be as below.
The X Wave is a reactionay wave , corrective in nature and usually is a Zigzag. It retraces the Previous A-B-C , here wave Y , by typically 50% and more. A Fibonacci chart for the same is given below.
This XX wave may be unfolding as below and has completed the A and B leg . It may now be in the 4th wave of the C leg. The Price objective as per C=A is apprx. 5470 and as per C=1.62 A is apprx. 5735 .
An Alternate view to the above count may be that the Corrective phase since Nov'10 has ended at 4720/28 ( apprx. 38% of the upmove since Oct '08 -Nov'10 ) and we are now moving up in the 1st / 3rd wave. It may hold equally good and will only be known after a Correction and further Trade from there.
Conclusions :
1. Technicals are suggesting not to be Proactively Bearish or Bullish now.
2. Uptrend may continue with 100-150 points left on upside . Resistance will come near 5450-75 range and then near 5530-80 level. Close above 5530 will be Bullish for Short term.
3. Initial Support may be near 5320-40 apprx. in the first half of the week and then near 5200 level later. Close below 5200 will be Bearish for short term.
4. Gap created on Friday,5220-5320, if filled fast, may only be in the second half of the week or later next week.
5. Avoid Buying Out of Money Options for next week.
6. Trades to be done for small gains rather than being Positional.
Broad Range of Trade for next couple of weeks may be 5200-5500. Believe in Screen and Flexibility will be the Key to Trade now.
Happy Trading !!!


10 comments:
THANKS FOR THE CLEAR VIEWS AND ANALYSIS
thanks for the valuable information
Been a while since I read your analysis. As always - Very comprehensive and unique compilation!
Thanks,
Girish
Beautiful analysis and eagerly waiting every sunday.Someone also suggested that we may test 3800 level.
@ Mridul ,
Thanks
@ Girish ,
Thanks for dropping by and leaving nice comment.
Always welcome
@Jagannathan ,
3800 is far away :) , Though I have a bearish short term view of 4450-4530 and will analyze further when target achieved or change in bearish TA.
Thanks for comment
Regards
Hi AAR VEE,
Waiting for your weekend analysis.
Regards
@ Sandeep-
1. Gap has been filled at 5215.
2. Resistance at 5400 and Support at 5200.Break and close at any one side will give a fast move.
3. Watch for Trendline break in both Hourly and Daily chart.
4. Bias is down till closes above 5400.
Thanks AAR VEE for ur kind precise outlook.
Regards
Post a Comment