Sunday, October 31, 2010

UNITECH

This is a post on Dear Manu's request for Unitech's TA.

Long term Chart :


Mainly sideways movement . The prices are above 200 sma but below 50 sma,being a high beta stock ,it does not gives clear signals with the bearish or bullish cross of these long term moving averages in the sideways movement.


Weekly Chart:


Prices above mid line of the Bollinger bands ,and 13-34 ema also bullishly aligned.The stochs are in downtrend ,though can reverse from mid region but cautions that trading can have more downside ,better to follow s/l to take care.One positive sign is that volumes were low in the last falling weeks.


Daily Chart:


The daily chart has indications of a bounce.Trading is near Bollinger band lows, with some indicators showing positive diversions and exhaustion in oversold area. The trend indicators is in sideways mode . But before going long caution should be  that the prices close above 5 ema then can add more when 5-20 ema become bullishly aligned and the indicators give 'buy' signal.The medium term outlook is also positive with 20-50 ema bullishly aligned.


Volume Profile :

The 10 d Profile shows a clear resistance at 90 levels.The upmove can develop only after the bounce settles above this.This level is also Ema resistance zone.


So, one may go long with a s/l below Friday's low ,if crosses 90 levels than can go to target B.B. higher band at 98 levels and above. Till a clear uptrend is not indicated ,it will be wise to book out at important resistances or part book there and rest with trailing s/l.

Weekend Analysis

Indicators :

The short term and medium term indicators are showing Positive diversion and signs of exhaustion in oversold area.This increases the probability of a bounce.
The Bollinger band range is 5960-6225 ,there may be consolidation in this range before any breakout .


Important Levels:

Please keep in mind the following important levels for the trading next week as per Volume Profile.


Option Analysis:

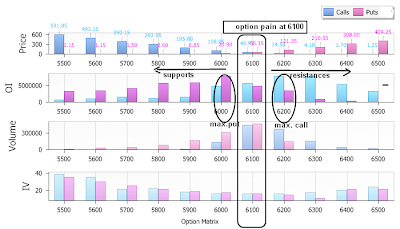
Since this is just the start of Nov. series and the build up at any strike is not abnormal ,I am not giving much importance to this.The Max. Call side buildup is at 6200 strike with O.I. of 42 lacs and that at Put side is at 6000 strike at 53 lacs.This indicates a range of 6000-6200 with positive bias ( same as Bollinger Bands.)
Out of money activity suggests that smart money is hedging itself with 6400 calls (45% addition) and 5600 puts (60% addition).This may be due to expectation of volatile and sudden move in near future due to major events coming up as U.S. elections , RBI meet & Federal Reseve meet.

EW Probability:

Please go through the last post on EW count -
http://o-j-n.blogspot.com/2010/10/ew-probability.html

The preferable count w.r.t. to A-B-C correction indicates the probabilty that this correction may have ended with the 'C' starting from 6151 and ending at our modest fibonacci target of 5935 levels.This will end the EW cycle since the upmove from 5350 levels.


Now for the future move, we look at the intermediate move since 4786 levels considering the above move as the 3 rd wave of this intermediate upmove and that the A-B-C correction as the 4th wave .

Correlating with the Indicators and other feelers the probability of the start of 5th wave
of the upmove since 4786 increases.


The Point Of Invalidation of this count is trading below 5935 level  ,which will voilate the hard EW rule of wave 2 trading below start of wave 1. ( we will then look at this as continuing of the A-B-C correction in a Double Zig Zag ( ABC X ABC )  manner to reach 5820 and below )

 I will be a buyer now with a hard s/l of 5935.Also it will be prudent to be on shorter side below 5935 level .

Some Pre Diwali Fire works in store for next week !!! Happy Trading .

Friday, October 29, 2010

Tuesday, October 26, 2010

EOD

Keep an eye on the level of 6110 and the Down trend line .


The day ended with positive diversion in indicators.


Trade light for next two days.

Monday, October 25, 2010

EW Probability

This is in continuation with the preferable EW count I have been following successfully since the upmove began from 5350.PLease check the last week's EW count Post -
http://o-j-n.blogspot.com/2010/10/ew-count.html

As per this count the 5th wave of the immediate upmove has ended in the start of the month at 6225 level. Since then we are in A-B-C correction of the upmove.This correction has taken an expanded triangle pattern,as mentioned in the weekender yesterday -
http://o-j-n.blogspot.com/2010/10/weekend-analysis_24.html , and seems to be a flat one with probable 3-3-5 wave count. The 'A' ,and today the 'B' part seems to be over and now the 'C' can unfold in the 5 wave form ,with this correction ending in the 5750-5900 zone.( we know of two imp. support areas down as 5820 and 5935 mentioned yesterday).


If i am a bit early in calling the start of the 'C' down then the Point of Invalidation of this count will be the crossing of today's high .i.e. 6151 level, since this is the start of the first wave of 'C' and cannot be crossed up now as per the EW hard rule. If invalidates this count than the targets for 'B' up are mentioned in last week's link given above.


As per the above chart tomorrow morning may see a bounce up ,which may be wave 2 up of the 'C' down. This should end below 6151 .(Also as per Volume profile today 6145 is the selling area ,hence a resistance for tmrw's trading.)

As per this EW probability ,one may go short now with a hard s/l of 6151 till 'C' ends

Sunday, October 24, 2010

Volume Profile of Stocks

I am posting 10d Volume Profiles of few top traded stocks.It's my experience that usually the TA part takes somewhat backseat in the expiry week and the position buildup of the series in the stock plays out for rollovers and expiry.

The volume profiles help us get the important levels ( all levels are spot prices ), keeping an eye on which we can play with some options startegy suiting our risk profile ( by writing some out of money calls / puts or keep these levels as SAR till expiry etc etc ). Please be very cautious and nimble as the premiums disappear fast .

RELIANCE


TATASTEEL


TATAMOTORS


SBIN


INFOSYSTCH


IFCI 


UNITECH


Trade with levels in mind and keep proper s/l or hedge for safety. 

Weekend Analysis

Since the start of the Month ,Nifty is trading in a range of broadly 6000-6200 and in an Expanding triangle Pattern. This is the correction/consolidation phase after the big upmove from 5350 levels of 900+ points . Coming up is the expiry week for this series and hopefully this phase gets over by next weekend.


Important Levels :

Seeing the 10d Volume Profile ,The Resistances are at apprx. 6090,6120,6185 levels and Supports at 6020,5965 levels.


The Fibonacci Retrace levles from 4786 to 6285 ( marked in blue) and that of 5350-6285
(marked in red) show important confluence levels at 5930 and 5820 levels which are also previous important Pivot levels.This phase can end at these levels if it trades below 6000 now.


Indicators :

The Short term Daily Indicators have risen up from oversold levels and can dip again from neutral levels.


The Medium term Daily Indicators are yet to exhaust in the oversold zone ,indicating some more downside.


O.I. & Rollover :

The max. Call side O.I. is at 6200 strike (apprx.79 lacs) and that of Put is at 6000 strike (apprx.77lacs).This has almost been maintained throughout the month but has an important change this week,

-The O.I. at 6200CE has exceeded 6000PE for the first time in this month,

-There has been decrease in O.I.at 6000PE from apprx. 85 lacs to apprx. 77 lacs this week,

-The O.I. of 6100 calls exceeded the puts at same strike.

-Futures O.I. also indicates closure of longs and lower rollover than last month.

All these indicates a bearish undertone and increasing probability of 6000 levels to give way.

The Max. Option Pain is nearer to 6100 levels now ,though this data is subject to change, the likely expiry can be at 6100 +/- 20 levels as of now.

Check the charts at Mok's post on options for further details-
http://o-j-n.blogspot.com/2010/10/weekend-of-charts-options.html

FII ‘s have been buyers all days in this week and net buyers throughout the month.They are accumulating at lower levels in this correction.

The EW count update of this sideways correction is giving more than one valid alternative.But my preferable count of 5th wave over and this correction being A-B-C of the upmove since 5350, points to correction reaching 5900 levels and below,before the next move starts in the intermediate upmove since 4786 level.

So the broader range trading range this week may remain the same ,6000-6200, but with Bearish probability of trade below 6000 levels. Major Supports come at 6020, 5935 and 5820 levels and resistances at 6090, 6120,6185 levels

Trade Light this week as the trade will be volatile due to pending rollover .

Friday, October 22, 2010

3 13 34 ema 5mTF intraday NIFTY spot chart

AARVEE had explained and
pointed out this during intraday
[refer http://o-j-n.blogspot.com/2010/10/chart-update.html]
the use of 13ema 34ema on the 5min Yahoo chart.
[The chart is available at the bottom of the posts in this blog live on refresh]

This is an addon to explain it.
alphabet1's additions:
1. Target 20 to 40 point max to begin.
2. Get out of trade in half hour in case nifty do not move as anticipated.
3. This is best used when confluence happens on key Support or Resistance levels.
3a. Target is the next key level with SL mid point of the level in reverse (if you are long at R1 then Tgt is R2 and SL is mid point between R1 and Pivot / S1)
4. once breach 34 ema hold position till the time 3 ema is not breached.
4a. May add position on bounce of 13 ema.
4b. In practice, once meets target of R2 and holds there , move up SL and revise Tgt for R3.
5. use STS and RSI to see overbought and Oversold scenario is in sync with the ema confluence.
 IF NOT DO NOT ENTER TRADE.

sujatha's input:
for short term we can book out @ 34 ema..this is working out very well.

Apart from technicals, one need "good knowledge and observation" of markets. 
Example - Most expected upside yesterday as per TA but didn't touch, 
Observation of "price behaviour" is important according to me. 
It doesn't mean TA is not good. :) that is a precautionary step for trading, 
once "market opens" all will change.


i will book 50% @ 34 ema without any secondary thought. (intra) 
My policy is "day trader" should not wait for the "exact target" whenever it comes book profit once 
and "trail the sl" 
then book @ swing (if know the swing level) 3rd part is positional.

aarvee adds:
1.I take only 13 and 34 ema as 3 ema gives lots of whips.and its obvious that in a 5 min TF use of 3will not be very fruitful.

2.Take only one trade in a day.Intra gives both sided pure opportunites only few days a month.

3.emas though are lagging but are safe ,wait for one candle to get below the bearish/bullish cross for added safety.

4.s/l should be put as per risk appetite but should be practical to give breathing space to the trade.

5.Indicators should not be much of a concern in 5min TF (on friday also u can see that trade on short side developed in oversold region of stochs.)

6.Profit booking should be done on the next target /pivot,we had 6050 in mind below 6090 from premkt.)

7.also note that 6114 was mentioned by sujatha and 6105 by vol. profile as imp. resistance.look for the confluence area below/above it and wait for signal to trade.Mkt gives time and tug there for enough time to enter as the level is imp. for both sides in a sideways mkt.

8.target should also be defined by the range of nifty or say the ATR.I have found half of the range as a realistic target and remaining half gives the trade signals and whipsaws.
Normally i find only a single onesided trade that if enetred well will do the needful in an hour.i.e both entry and exit.rest of the time is watching signals and general tug of war not reqd. to be read into.

9. Possible trade should be with the trend and if the trend is sideways (as is since few weeks)trade should be light and nimble.

10. There will always be loosing trades .If fast enough to reverse a loosing trade then ok or else one should get stopped, sit out and enjoy.

Chart Update

5d Volume Profile


Update at 2.45 pm


UNITECH

UNITECH FOR THIS SERIES (For Dear Mok & Manu)-

Intra EW

Yesterday -
Today -

This is only a probability. pL trade with proper s/l .

Update :
The above count was invalidated below 6080 levels  : ((

Thursday, October 21, 2010

THANK YOU !!!

All Friends At OJN Thank Mr. Rajandran , Author of the popular blog "Market Calls" , for adding the link of our Blog at his esteemed site.

Mr. Rajandran is one of the finest technical brains of the blogging world and a very helpful person. He can be reached at his blog - http://www.marketcalls.in/
for any technical and general queries by the visitors.


We are also Thankful to -

http://financeandtradingmadeeasy.blogspot.com/

http://tryin2trade.blogspot.com/

http://niftypointandfigure.blogspot.com/

http://sharegiri.blogspot.com/

for similar gesture.


Best Wishes & Warm Regards,
MySpace GraphicsMySpace Graphics

Intraday

Thank You !!!

All Friends At OJN Thank Mr. Rajandran , Author of the popular blog "Market Calls" , for adding the link of our Blog at his esteemed site.

Mr. Rajandran is one of the finest technical brains of the blogging world and a very helpful person. He can be reached at his blog -   http://www.marketcalls.in/
for any technical and general queries by the visitors.

We are also Thankful to -

http://financeandtradingmadeeasy.blogspot.com/   
                                      
http://tryin2trade.blogspot.com/

http://niftypointandfigure.blogspot.com/

http://sharegiri.blogspot.com/


for similar gesture.


Best wishes & Warm Regards,


MySpace GraphicsMySpace Graphics
Share
Subscribe