The August series ended with the maximum damage to the Prices in the downfall since Nov ’10 ( from 6338) . The prices corrected from 5700 levels to 4700 levels , apprx. 1000 points fall and now we are trading at multi-months low ( new 52 week low at par with May ’10 levels ). Let us check out the Technical probabilities for the Short Term –
1. Indicators :
The Weekly Chart shows Oversold Indicators with no sign of reversal of this downtrend as of now.
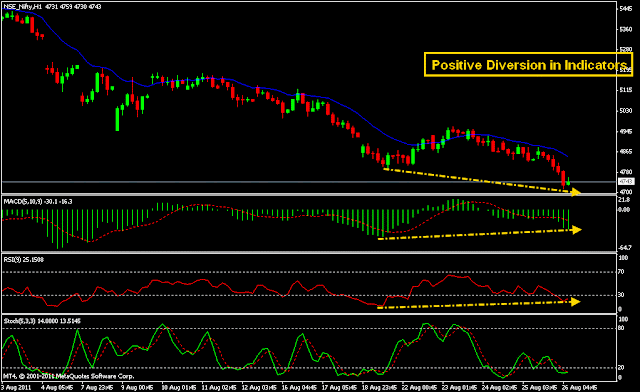
The Daily Chart also shows movement near Oversold region and has a Positive Diversion with prices making new lows and Indicators started showing strength.
Similar to Daily Chart, The Hourly Chart also exhibits Positive Diversion in Indicators.
The Positive Diversion indicates a Technical Bounce on the anvil.
2. Moving Averages:
The Trend Indicators Averages for short term 5-20ema along with intermediate -20-50 and long term 50-200 dma are all Bearishly aligned. It shows the firmness of the ongoing Downtrend in all Time Frames.
Any Bounce now would be Resisted at important Averages .
3. India
The Volatility Index – VIX is a contra-indicator as the volatility increases near a bottom and tends to lower down at tops. The VIX values are near the Top end of the recent short term range.
Short Term Bottoming out may have started.
4. Patterns and Trendlines :
The Hourly charts show a ‘ Falling Wedge’ Pattern in the making .The results of this pattern can be Bullish at the end of a Downtrend , though in itself its not a Reversal Pattern but a Continuation one.
So within a Larger TF downtrend , this pattern can give a temporary relief on the upside.
Also watch the break of Trendline shown in the Hourly chart under Elliott wave subhead for confirmation of the upside break.
5. Option Analysis and Futures O.I.
This is just the start of a new series and hence data is more on the hedge side of the rollovers from last series. It shows a broad range of 4700-5000 with a new developing Support at 4600 in case of break of 4700 . 4900 is a neutral level which may be a broad SAR as per options data. The Implied Volatlity of the Put side is greater than on the Call side so Writers will be more happy selling the Puts.
The Nifty Futures Open Interest Data is interesting. Last trading session added apprx. 28 lac shares with a significant decrease in the Cost of Carry. Clearly they are Shorts formed at the break of 4840 level ,the last series Expiry Price. The selling is also confirmed by last day’s volume profile.
So a Short Squeeze is waiting on trading above 4850-4900 levels now.
6. FII Data :
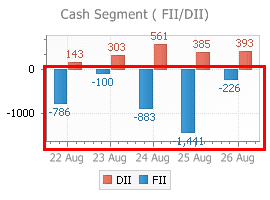
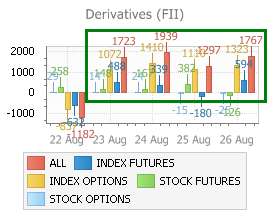
The FII’s have been Net Sellers in the Cash Market and have sold record volumes this series. But for the short term they have been a simultaneous Buyers in Derivatives .
This shows a hedging and a probable short term outlook of a caution against the Downtrend.
7. Elliott Wave Analysis :
Please check the basic Wave counts – Click Here
As per the Preferred view we are in the 3rd wave of the second zigzag (Y) .
The Subwave count indicates a probable completion of the fifth wave of this 3rd . (The MACD also has given a positive diversion between the third and fifth wave of this 3rd in the Hourly charts above ) .
A last leg may be left in the the completion of the vth of the fifth of the 3rd.
So as the 3rd wave is nearing an end , We can look for the 4th wave up ,The Fibonacci Chart below gives the probable Targets and Resistances. The chart can be modified if a new low is formed.
8. Volume Profile :
The Profile shows 4840 can be kept as SAR for short term and managed to trade accordingly.
Trading Insight :
After the sustained trending down move , an Upwards correction is indicated by correlation of the above Analysis. The quality of the bounce will be tested at Resistances . One should always remember that we are in Larger Frame Down Trend while trading this corrective bounce .
Have a Profitable Trading ahead !!!


14 comments:
Hi aar-vee...thanks for ur analysis....i got some updates too...thanks...::http://markettechnicals-jonak.blogspot.com/
Hi Jonak,
Thanks for sharing ur blog link. I find u have got a good blog going. I have added the reciprocal link of ur blog here.
Keep it up.
hello RV-as u mentioned its hourly and daily poisitive divergence with some positive global cues that are the only silverlinings in the downtrend and we are in ression phase and as per benner cycle it can last for 2012 but market never goes in one direction and waves and pulses are the charrector of human behaviour and expert trader can encash that.thanks RV for precise and perfect presentation.
RV,
Its a falling wedge and break out at 4850.
Thanks Manojji,
Corrected the chart.
Hi RV,
I m die-heart fan of ur analysis. One question, which level will confirm the end of 'vth' wave of this III wave and beginning of IV wvae of large C currently which is on the making. Can it be 4850??? Please guide. Thanx
@Sandeep,
the v-3 will end when the prices cross the i-v-3 i.e. what we think is the ivth-v-3 voilates the hard rule that the 4th wave should not cross the end of 1st wave. so in place of ivth subwave of v-3 up, its a new wave and the recent bottom is the end of the v-3. for that the labelling should be correct.
Sir,
My label for i-v-3 is at 4840. So it has breached the law as it is at ~4860, can i take it as a new wave now....is it correct
Thanx
Dear RV!
Good work as usual, nice presentation with solid reasoning.
Rgrds
Kumar
Thanks Kumarji
Regards
Dear RV, SAR is still 4840 or any change??Volume chart saying still same..Thanks
@Niftymagician,
sorry I missed to reply to ur comment. Thanks here and also for the study u have sent me by mail.Its quite interesting ,do share regularly.
Regards
@bizagra,
It was a breakout from a very oversold markets and still only two days old ,so have patience when new auction emergers ,it will show up. Also if u want to carry with trend u can use trailing s/l.
Respected RV sir,
Thanks for ur comments and guidance.
Our Heartiest EID Mubarak and Happy Ganesh Chaturthi. May Allah and Lord Ganesha always bestow glories, Successes and happinessess all of us.
Sandeep
Thank Sandeep,
FESTIVALS GREETINGS !!! to All.
Regards
Post a Comment