
Nifty is trading at a very important juncture after almost a month of range bound trading between apprx. 5900-5700 levels . Posting a Technical analysis corelating the Indicators,Volume Profile, Moving Averages ,Trendlines, Patterns, Option analysis ,Fibonacci and Elliott wave data , to gauge the further movement in short term and formulate a trading startegy for the next week.
1. Indicators :
The Weekly Indicators are in the sell mode and Nifty is currently near the mid Bollinger band. The trading is range bound since last four weeks. Trading below the mid B.B near 5700 will signify weakness and open the downside.

The Daily chart is in the ongoing sell phase ,yet to reach oversold zone. Its trading near lower B.B and the mid B.B. comes near 5830 level. Only the cross and close above it will signal strength.

The Hourly chart has entered the oversold zone and is ripe for a technical bounce. Its trading near lower B.B. and midpoint is near 5800 level.

2. Moving Averages :
The moving averages in the hourly charts are bearishly aligned and short term averages 5-20dema though are bullishly aligned but are nearing a inflection Point. The Long Term 50-200dma are still bearish.


The support in the near term is coming from 200dma on closing basis but has closed below 20dema (near 5790) in last trading session.

3. Trendlines & Pattren :
The short term Trendline in the Daily charts has been broken and may prove a resistance in any upmove.

The Down Trendline has proved a major resistance .Trending upmove possible only on break of it.

The Triangle of apprx. 200 points has been formed ,the break of which will give a good trending trade on any one side.
4. Volume Profile :
The 2d Profile indicates near term strength above 5790 level with Resistance coming near 5835 level .

The 10d Profile clearly indicates weakness below 5890 level in short term.

5. Option Analysis :
The trading range has shifted down towards 5600 compared to last series of 5700-6000 . It shows anticipation of some weakness by market players.
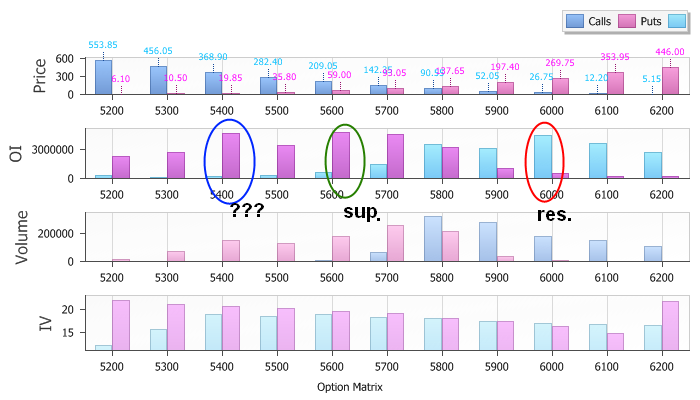
Interesting aspect is the buildup of 5400 puts in significant quantity at the start of the series. Is the smart money hedging against a fast move down below 5700 level ???
6. FII Data :

The FII's have been clear Sellers in near term in this range trading . Is this the indication of the range to be broken on the downside ???
7. India VIX :

The VIX has been trading near the lower end of the range . Since its a contrarian signal , any move up will cause a downside.
8. Elliot Wave Analysis :
Please refer to the short term EW insight that I have been following - CLICK HERE
and in subsequent weekly post.
We may be in the 'b' wave of the 'C' of the larger B wave ,correcting the whole of the wave A since 6338 to 5177. This b wave has already developed a triangle and can go on in the range bound , low volatility , low volume trading in the a-b-c-d-e Triangle pattern shown in red colour. Break of triangle on the up for a pending c of the C will target 6100 apprx. as per Fibo charts posted earlier.

Alternatively this C wave of the Larger B has ended as shown in the blue colour (with a truncated last wave c ) .This will end the larger wave B retracing 61.8% of the wave A. The larger C may have started which will break down 5700 levels quickly. Target for this C down will be apprx. 4800 level.
The Option and FII data points towards the alternate count as of now.
So, corelating all the data above , a likely Trading startegy for Nifty next Week may be :
1. There may be a technical bounce up on Monday or Tuesday . The quality of which will decide further trading.
2. The Resistance comes at 5790 and 5835 . Strength for the Week only above 5835.
Below 5730 /200dma on closing basis it is weak. One should be Positionally short below it with proper S/l for any whipsaw.
3. The RBI Meet on Tuesday may be the next trigger for a Trending Market in short term.
4. Positional long only above 5890. Below it the short term bias is Weak
5. If trades near 5835-50 , New shorts may be opened up with s/l of 5890 (check for intraday indicators here) . It will be a good risk-reward probability. One should reverse the position above 5890 .
6. The SAR for inital half of the Week may be 5835 , which may be changed to 200dma or 5890 if breaks and closes below/above any of these levels.
7. Technical target on break of these levels is apprx. 200 points .
Nifty is at a crossroad , Trading with the Trend / Price level mentioned above and flexibility to trade without bias will reap good Profits .
6 comments:
Excellent and comprehensive analysis and guidance for the week.
Thanks and Regards,
ttthakur
nice analysis rv. have been reading u almost for a year now and seen ur views being more right than many. what i want to point out is that the book i read abt ew( though its a beginners only) vehemently denies the possiblity of triangle at B. though in neowave it is acceptable i guess.
i have not read pretcher to know his views.
@ alpha 1,
Thanks for dropping by and leaving ur comment
@ttthakur,
Thanks
@ Piyush Sharda,
PS, Triangles are just balancing pattern for sideways movement ,a consolidation before a breakout.
Here is what EWI has to say-
"Although upon extremely rare occasions a second wave in an impulse appears to take the form of a triangle, triangles nearly always occur in positions prior to the final actionary wave in the pattern of one larger degree, i.e., as wave four in an impulse, wave B in an A-B-C, or the final wave X in a double or triple zig-zag or combination . A triangle may also occur as the final actionary pattern in a corrective combination, although even then it always precedes the final actionary wave in the pattern of one larger degree than the corrective combination."
Hope u get my view point about wave B triangle.
and Thanks for always checking out and leaving wonderful comments of encouragement.
ok ewi allows..... thankx for copying the text
Excellent and comprehensive analysis and guidance for the week. Thanks and Regards, ttthakur
Post a Comment