The Elliot Wave technique provides for Price forecasts which have high probability of occurence.We will go through some of these methods to get the probable Fifth wave target that we are in ,of the upmove since 5350.

Method # 1
Most common method of Price projection suggests that ,When wave 3 is extended ( as here) ,the wave 1 and 5 are related with equality or 1.618, 2.618 fibonacci ratios.
Wave 1 is 165 points, so wave 5 can be 165 , 267 or 432 points ,now considering the wave 5th start at apprx. 5965 , targets can be 6130 ( done ), 6235 , 6395 apprx.
Also in a related observation, if wave 1 is not extended ( as here), the wave 4 divides the price range of the impulsive in Golden ratio ,in such cases the wave 5th section is .382 of the total distance ,provided wave 5 does not extends.

So going by this logic the target comes to 6345 .

Method # 2

Method # 1
Most common method of Price projection suggests that ,When wave 3 is extended ( as here) ,the wave 1 and 5 are related with equality or 1.618, 2.618 fibonacci ratios.
Wave 1 is 165 points, so wave 5 can be 165 , 267 or 432 points ,now considering the wave 5th start at apprx. 5965 , targets can be 6130 ( done ), 6235 , 6395 apprx.
Also in a related observation, if wave 1 is not extended ( as here), the wave 4 divides the price range of the impulsive in Golden ratio ,in such cases the wave 5th section is .382 of the total distance ,provided wave 5 does not extends.
So going by this logic the target comes to 6345 .
Method # 2
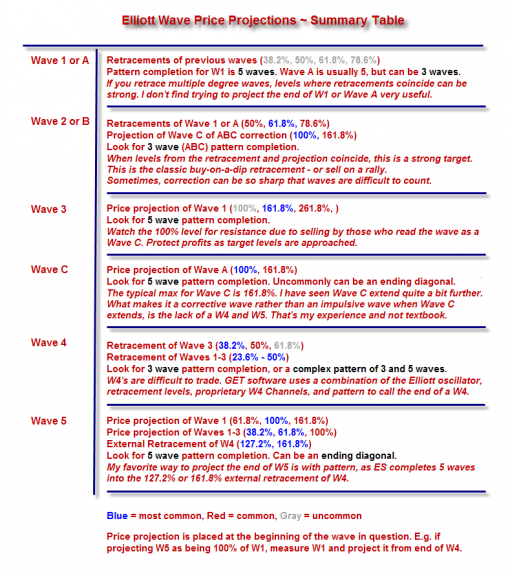
The Price projection table here ,suggests a 38.2 ,61.8% price target of wave 5th above the net length of wave 1 to 3.

Net length of wave 1-3 is apprx. 725 points ,38.2% will be apprx. 275 points ,61.8% will be apprx 450 points ,
Targets will be apprx. 6235 and 6415 in this case.
Method # 3
This method is the Channeling technique.
After identification of the wave 4th a new channel can be drawn with trendline connecting wave 2 and 4 and other running parallel starting from end of wave 3 .The wave 5 may end near the channel top or within it depending on its extension.
Below is the Trendline connecting wave 2 and 4 ,break of which may signal end of wave 5.

Conclusion :
The modest Targets of the wave 5th can be projected as apprx 6235 and 6345 .
Above these the extended wave targets will be 6395 -6415.
God willing / forbids (as u like it ) , if the wave 5 extends by 100 % of net length of wave 1-3 ,the target will be apprx 6700.
Do remember it is typical of wave 3 and 5 both to extend.
9 comments:
@ AARVEE - thanks for the good presentation. Proving Sir's "shisya" :) what "mynac" said is right the para "6" is very impt. to remember.
@ mynac - thanks for the inputs. Unforgettable "fall". but watever technically "OB' etc;, + coincidence is $ + our INR bottoming out i think anybody checked, as per my little observation it's a "time" for "reversal"??? atleast in this week? only time will tell. Till then crossed fingers. But "Market" is doing always against "majority"??
@ mynac - one more observation 13th december 2007 is 6185 after that it shoot upto 6260/6357..probably if the market not showing any weakness in this "6185/200 area" then it's doubt to come down, sure higher levels??
Dear AARVEE,
Thank you very much. Timely analysis, which will be very useful to plan the trading. Almost we got the price target but time target?
@mynac
thank you.
@ Sujatha,
nice observation.
though i dont actively follow the currency -index relation ,but whenever the dollar weakens ,the Fii's pour money here to get superior returns in dollar terms.
@ U.K.Raj
not clear on time targets ,just started being cautious now as bubble has started inflating ,when will it be pricked is anybody's guess. we should be prepared.
Dear AAR VEE,Sujatha,
What a coincidence. If the probable top shall be 6345 as you mentioned then it's almost the same like the previous one on 9/1/2008 i.e.6336
Last time when market shown 6336 the option trading/participation was less popular & there was almost no retail participation.Rather it was used for hedging purpose by institutional investors.Please look at the data on a day before great fall for that time's nearest strike prices.i.e. on 08/01/2008
6300 PE Rs.187.20 O.I. 5,62,100
6200 PE Rs.147.10 O.I. 16,33,900
6100 PE Rs.117.25 O.I. 22,82,750
6000 PE Rs. 93.30 O.I. 22,63,150
5900 PE Rs. 75.90 O.I. 21,21,050
And these are the prices on 22-01-2008 (just 10 days later)when Nf show 4420
These were the tops on that day.
6300 PE Rs.1949.95 O.I. 6,70,500
6200 PE Rs.1990.00 O.I.10,94,550
6100 PE Rs.1650.00 O.I.18,33,050
6000 PE Rs.1630.00 O.I.19,25,000
5900 PE Rs.1480.00 O.I.19,82,400
hi RV, sujatha, mynac. :)
RV, marvelous efforts, we would call you wave surfer now. Thanks for bringing out the levels so clearly, its a huge effort on your part.
Sujatha, all different levels seem to conclude at similar levels. The gann and fibo agree with RV,
Mynac, you brought out in convergence the view RV is projecting. Great observation.
Thanks all.
The difference between last rally (2007-08)& the rally this time is mainly participation & the style of participation in option category.
In 07-08 rally,the option trading was used mainly by Institutional players only & mainly for a hedging purpose.The O.I. reflects the fact.Retailers were almost not familiar to it so did not have that much kind of an idea of the price movement.
This time the participation by both parties are almost twice or some times more than it.
On a certain day Sudden huge put-call writing in nearest strike prices used to surprise market players.Retail Market players cannot react appropriately in time.The institutional players act rather more swiftly which gives no time to retail investors to act in time.So almost every time retail investors are on the loosing side.
@ mok
whatever the projections are we should now cautiously trade price indicator only till futher clarity emerges. caution is the key to survival
Thanks for your presentation of length of wave 5, excellent.
Post a Comment