The basics of the Elliot Wave Theory has helped me gauge the Market structure and have a probable path to trade the waves. I am posting my perspective of the markets since 2003 and have tried to divide it in lower time frames to link these waves to larger version for easy understanding. The supporting analysis of Volume profiles , Option open interest & Liquidty flow by FII’s, at major turning points (like at the end of August series near 5350) , helps in getting interpretation of the Wave to unfold. Similarly having alternative view of wave counts helps maintain the necessary flexibility required for trading.
CHART -1 (since 2003)
It shows a clear five wave upmove from 2003 till Jan 2008.After that the correction sets in larger A-B-C waves.The A wave ends in Oct 2008 in a downward five waves pattern.From there starts the B wave in a corrective three wave upmove .The subwaves 'a' and 'b' of this larger B ends at March 2009.


CHART -2 (since March 2009)
It shows the 'c' wave of the larger corrective B unfolding in five waves up.Probably this subwave 'c' is now in its fifth wave.


CHART -3 (since May 2010)
It shows the 5th wave of subwave 'c' starting from end of May 2010 ,near 4786 level, and moving up in five wave pattern. This also may be in the last leg of it's 5th wave.

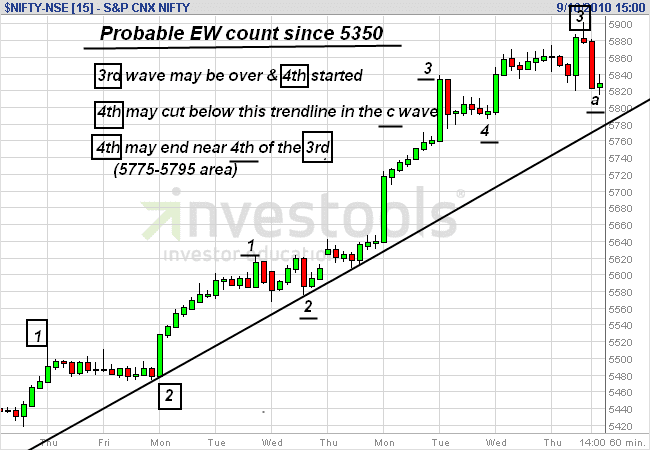
CHART -4 (since Sept 2010)
This shows the 5th - 5th - c- B ,which started since 5350 levels.It may be in its 4th wave & 'b' subwave.

ALTERNATE COUNT :
This view takes Nifty to a new all time High rather than ending in a double top or below the previous high of Jan 2008 as would in a regular B.This view corelates with the Channel pattern (since Oct 2009) break giving target of 6300 + .


CHART -1 : The Larger B may be an irregular corrective which crosses the point of start of A .i.e. it goes above high of Jan 2008.
CHART- 2 : Instead of the 5th wave, it is the 5th subwave of the extended 3rd wave since March 2009.
CHART -3 : Remains the same.
CHART -4 : Instead of the 4th wave, it's the extended part of the 3rd wave continuing still.
Alternate count may be read as,
3rd (since 5350) - 5th (since May'10 ) - 3rd (since July'09) - c (since March'09) -B (since Oct '08).
Keep these charts handy for future short term swing and long term positional trading as the Markets show their hands.
Alternate count may be read as,
3rd (since 5350) - 5th (since May'10 ) - 3rd (since July'09) - c (since March'09) -B (since Oct '08).
Keep these charts handy for future short term swing and long term positional trading as the Markets show their hands.
5 comments:
Hi Aarvee,
Quite nice observation.
However, the current iii of c in B does not look like to be a 3rd wave characteristics.
Moreover, kindly note wave i - 2200 points (approx.), wave iii - 1500, so wave v - 4800 + 1500 = 6300 (max) which will coincide with all time high! Hence, a chance of irregular correction under the current count is ruled out.
Rajib,
Thanks for going through the post.
Ya its clear in the preffered count that B should not cross the start of A (6287).
(charts are based on closing prices)-
for chart2-
wave 1 = 4655-2573 =2082
wave 2 = 4655-3974 =681
wave 3 = 5374-3974 =1400
wave 4 = 5374-4806 =568
wave 5 = 4806+1400 =6206,i.e ,should not cross 6206 on closing basis, for wave 3 to be not the shortest.
In the alternate count as i have mentioned ,if the wave B crosses 6287 then in chart 2 the relabelling will be that its not the fifth but the 5th of the third(and 3 & 4th waves will become subwaves 3 and 4 of the third wave) ,may be then the third wave will look like one as u pointed out.
lets see and be prepared.
hi RV :)
great output & outlook.
looks like a possible hesitation at the gateway,
and a probable move eitherside,
and when it comes it can be steep ...
will keep tight TSL, reentry as it goes, to take max benefit eitherside.
thanks for the deeper thoughts.
have a great weekend.
will try to catch up when getting next break.
bye
@Aarvee,
Very nice presentation from bigger charts to minor charts alogwith alternate count. Easy to understand and grasp.
Thanks & Regards,
Veer
mok,
Thanks for ur charts ,they save time for weekend analysis.do post as and when time permits.
Veer,
Thanks for the comment.Hope the post helps u in trading.
Post a Comment