
REPOST OF 13-07-2010
-------------------------------------------------------
Hi All,
Pl. check the attached chart.
5500 wont come in a hurry seeing a call built up of above one crore at 5500ca.max put built up is at 5200.
I will trade this range, 5500-5200,(5250 has good support) on monthly timeframe untill drastic change in open interest happens. will try and short above 5400 levels for positional trade.
regards
RV
----------------------------------------------------------
POSITIONAL ANALYSIS-
I am posting the following analysis with bearish frame in mind as u can see from the post above, I am bearish since last week start .The conviction I get is from the charts I post below.
1.NIFTY SHORT TERM CHART:
This chart shows a convincing break of short term trendline which supported Nifty since the start of this recent upmove ,hence bearish

2. NIFTY 10D VOLUME PROFILE:
This chart shows max. volume build up at 5380-85 levels.A break and close below this level will be bearish ,with next volume support coming at 5250 levels.

3.NIFTY DAILY CHART WITH INDICATORS:This charts shows the position of basic indicators as MACD,RSI AND STOCHS on daily chart .They are indicating bearish traits.

4.NIFTY WEEKLY CHART WITH INDICATORS:This charts shows the position of basic indicators as MACD,RSI AND STOCHS on weekly chart .They are indicating neutral to bearish traits.

5.NIFTY LONG TERM TRENDLINE CHART:
This chart shows a trendline which supported the movement since last one year .It was broken in last correction and now trading above it.The breakpoint has come near and a close below 5300 would be bearish.

6.NIFTY FIBO –FAN CHART:
This chart shows a trendline which supported the movement since last one year .It was broken in last correction and now trading above it.The breakpoint has come near and a close below 5300 would be bearish.

6.NIFTY FIBO –FAN CHART:
This chart has helped in getting some good resistances in last upmoves.5450 levels shows a strong resiatance zone

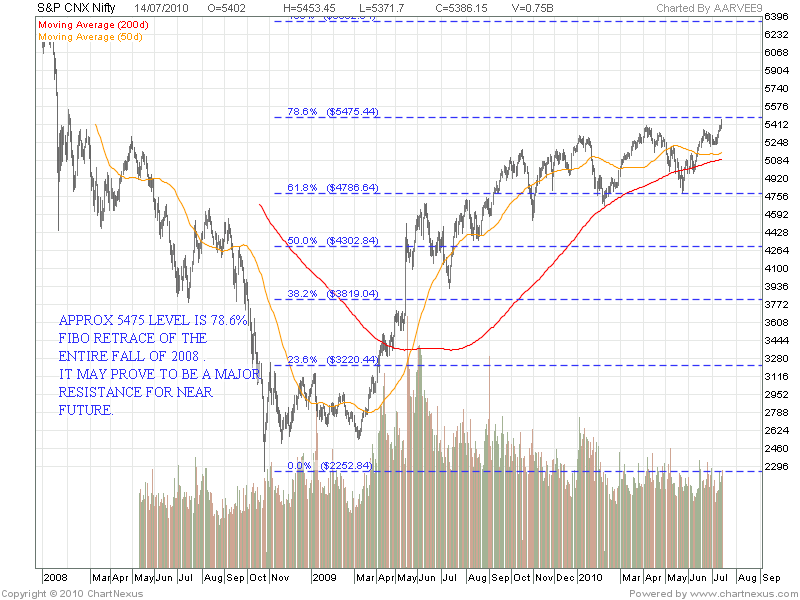
7.NIFTY LONG TERM FIBO-RETRACE CHART:This is a two year chart .This is based on theory that the rally since last year is a bear market upmove.The 78.6% retrace level of the total downmove since 2008 to 2009 comes at approx 5475 levels .Crossing it will only give a bullish thrust.

CONCLUSION :I think based on above charts that markets are poised at a critical juncture .I favour a bearish scenario until proven wrong by price action. As posted previously in some posts ,I look at likely target of 4700 levels in medium term.
This theory gets negated on couple of closes above 5450 and will prove to be a bear trap.
Since positionally short from above 5400 levels this gives a good risk reward ratio.
STRATEGY:Have shorted above 5400 levels last week.
Break of 5380 levels will signify short term weakness as this apart from high volume area is also daily 5close ema.Close below this will give a positional target of 5250 levels which are also high vol. support area and weekly low 5 ema levels and monthly 5ema levels.Next ,check the price action at 5250 levels and decide.
Open Interest analysis shows range contraction from 5200-5500 at the start of the week to 5300-5500 at the close of week.So seeing the build up also a likely range of 5450-5250 comes into play.
7.NIFTY LONG TERM FIBO-RETRACE CHART:This is a two year chart .This is based on theory that the rally since last year is a bear market upmove.The 78.6% retrace level of the total downmove since 2008 to 2009 comes at approx 5475 levels .Crossing it will only give a bullish thrust.
CONCLUSION :I think based on above charts that markets are poised at a critical juncture .I favour a bearish scenario until proven wrong by price action. As posted previously in some posts ,I look at likely target of 4700 levels in medium term.
This theory gets negated on couple of closes above 5450 and will prove to be a bear trap.
Since positionally short from above 5400 levels this gives a good risk reward ratio.
STRATEGY:Have shorted above 5400 levels last week.
Break of 5380 levels will signify short term weakness as this apart from high volume area is also daily 5close ema.Close below this will give a positional target of 5250 levels which are also high vol. support area and weekly low 5 ema levels and monthly 5ema levels.Next ,check the price action at 5250 levels and decide.
Open Interest analysis shows range contraction from 5200-5500 at the start of the week to 5300-5500 at the close of week.So seeing the build up also a likely range of 5450-5250 comes into play.
14 comments:
wwow :O ...
gonna read now ... looks like another Vivek Patil on the make
:)
[thinking to myself: should hav known from seeing that bear's aggressive stance that this is coming ]
:)
great charts
really, RV, you should blog with this format more often - ppl'd flock to read this kind of thing. I'd definitely trade on this kind of clear sightedness.:)
RV,
one small suggestion,
the charts can be magnified to next level or one next to that.
will mail you.
Dear Aar Vee,
Simply Perfect
Thanks & Regards
Sanjay Kr Jaiswal
No need of breaking or itching head :)
Very clear views..any layman (like me) can understand and trade easily.
Hm..hope my short is worth?? :)
thanks and regards
PS : I will be more happy if DOW touch again the previous old level
now all the charts are right size
RV,
Absolutely crystal clear observations.Am in sync with your views.
manoj
Dear AAR VEE,
Nice analysis.As you mentioned,4700 has definitely an importance because Nifty future has almost never traded below 4700 since Feb 2010.I am hopeful about your 5500-5200 range.Thanks for detail analysis.
and i have downloaded and saved that "angry bear" also,
:)
nice post RV..only few articles/view points/charts will stick with mind while trading and surely this is one of those..
good one . was hoping a bump up to 5400? looks like we wont get that also.
Thanks ALL for the nice words
Remember that best of the setups go bust.Trade the conviction with proper hedges or stoploss.
A title of the Bond movie says 'Die Another Day'.U can with a hedge or s/l.
tussi great ho pa ji..
i thnk ur wrk is more comendable than ur lyricist frnd:)
Post a Comment