
Markets are now poised at critical juncture in Long Term time frame . News flow and associated reactions may muddle our vision . Lets objectively analyze it Technically so as to try and get a probabilty that will help us navigate the short term moves keeping the Long Term TF in hindsight.
I did the last Long Term Analysis in Jan. this year and suggested coming weakness based on Technicals. - Click Here
1. Moving Averages :
The Long Term Moving Averages are clearly Bearishly aligned with a 50-200dma giving a Death Cross. No Upmove of consequence will unfold trading below 200dma as of now.

2. Trendline :
The Weekly chart shows a breakdown of a Long Term Trendline that was holding Support since Nov. 2009 and never had been voilated on closing basis. Last Weekly close was a 52 week low close , lower being that of the week ended on 11-06-2010 .

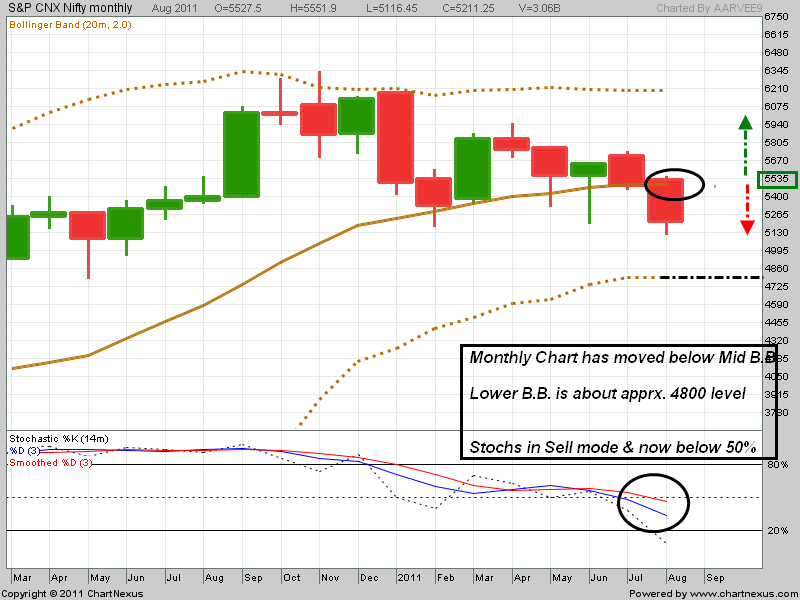
3. Indicators :
The Indicator on Weekly chart is on sell mode (above) and that on Monthly chart is also on Sell mode (below) . The prices on Monthly basis have closed below mid B.B. for first time in many months and now may target lower B.B. near apprx. 4800 level .
4. Fibonacci Levels :
The retrace level of the total Upmove since 2252 - 6338 ( 2008 lows till date ) shows that we may be approaching the 38.2% level near 4800 apprx. in this leg of downmove.

5. Pattern :
The Pattern visible in above chart is that of a Descending Triangle that we have been following on weekly basis also. The Pattern is Bearish in nature and generally gives a breakdown below lower Trendline . It had violated the trendline in last trading session but closed above it. Height of the Triangle is apprx. 1140 pts. if breaks down below 5200 ,it will have a target of apprx. 4060 !!!

6. Elliott Wave Analysis :
Please check out the EW count and Insight that I have been following on Long term charts - Click Here
The chart below shows the Preferable broader count in Blue and an Alternate count in Black.

If we go by our Preferable count of Double zigzag then we are in wave C of second zigzag Y.
Now if wave C is equal to wave A of 745 points apprx. then we get a target of apprx 4995
and if wave C goes to 1.62 times wave A then it will be apprx. 1210 pts and target apprx 4530
Any trading below the 4530 level of Preferable count will make the alternate count logical.
If we go by Alternate count of a single zigzag , then also we are in wave C but the targets will be
If wave C equals wave A then C will be of apprx. 1160 pts and target 4785 appx , this is also near 38.2% fibo target.
and if wave C is 1.62times wave A then it will target apprx. 4065 which is the target of the Descending Triangle pattern.
Invalidation :
The above Long term analysis will give signals for invalidation if -
1. Prices start trading above 200dma
2. There is a Monthly closing above mid B.B. near apprx. 5550
3. The Descending Triangle gets busted . This Pattern has a 16% failure rate which should be kept in mind. Close above the falling Top Trendline will confirm it.
Conclusions :
1. As of now 4800 can be a conservative Target which has a high probability of being met.
2. Will the Market stop at 4800 levels when this has been so much anticipated and talked about level ? I think 'No' in case we get to it.
3. In case of Invalidation signals , forget everything and just trade in Opposite direction with Targets of a New all time High in sight. ( We will fix the counts later :))
26 comments:
Dear RV!
Nice depiction of every chart & count, Its watchable & good work...keep it up.
Rgrds
Kumar
Good Analysis RV.
thanks aar vee
Dear RV
Simply superb.
Excellent work sir, just superb. I am your silent admirer. Great work. keep up your noble cause of helping the novice trader.
Amazing! I get so much confidence after going through this technical analysis.
Thnakyou verymuch
Dear RV,
Happy Friendship Day and Thanks for your views.
dear RV all parameters taken into account nicely and every one is for a bearish signal the only concern still is usd/inr . why still rupee is still 44-45 range and not falling to 47-48 range and till rupee is below 45 nifty may not fall and dollor weakness may appretiate rupee and that can be a supportive of indian stocks and infact i m surprised to se rupee still below 45/dollor inspite of heavy selling by FIIs in last week.the best stretegy is to buy dollor and sell nifty at this juncture.
dear R v all parameters are taken into account nicely and world is in doubble bottom recession the second dip may be more painfull and long since banner cycle clearly indicates bearish till 2012 and from 2014-18 are the new bull years,the only concern is the rupee/dollor which is still below 45/usd while this must be near 47 this time and till rupee remains here indian stocks may not fall further infact i m surprised to see rupee here even after heavy selling by FIIs last week,it means they have not taken all money from our country and parked here only for an opportunity to er-enter on lower levels.so till rupee is below 45.50 i m still doubtfull of this fall to go more deep.thanks for all the analysis u did as we are getting all without any hardwork.
Happy Friendship day to All and Thanks for visiting and leaving ur comments.
Regards
@ Nifty magician ,
We can also look at the USD INR in the sense that if dollar goes stronger and Rupee to 47 levels than more fall is waiting :). This may just be the start of a down leg.
Hi RV,
Excellent analysis! I am a silent viewer of ur blog and learning TA. Do you think nifty may have made bottom (triple bottom) on Friday and if Friday's gap is filled very soon (in this week) then it may start trending up?
Hi RS,
Ew suggests a wave down i.e vth of the 3rd with a modest target of 4990-5050. Market may test it and form intermediate bottom here.Then may travel to 5300 or above in the 4th wave. Thats my take but lets see the price action unfolding.
Any short term reversal will only be above 5405 ,though a quick gap filling in next week may surprise me.5330 will be an initial resistance.
Better to keep 5200 as SAR now and trade.
Hi RS,
Recently i have started learning elliot wave. I need your clarification on this.
As per your counting iii wave of 1-C(Square) ending in 5452 level. This should be end around 5394 level. Please correct me, if i am wrong. The ivth wave doesn't qualify as Flat or irrugular flat.
Therefore iiird wave should end in the level of 5336.
Please explain...
meena
http://4.bp.blogspot.com/-pze21IpYmLA/Tj6DFCu-UvI/AAAAAAAABWY/BcdbB-9RH7I/s1600/Nifty-EW.png
Hi RV,
Just 2 words for u SIMPLY AMAZING the way u depict ur illustrations and guide us with ur immense knowledge.
Thank you RV sir. Excellent.
LV
Aarvee,
Excellent Analysis. happy friendship day
@ Anonymous -
I try to break up the broader labelling on the hourly charts as u must have seen in the older posts.May be the five waves were over there to mark it iii-1-C but U may be right that it might have gone to the next pivot low in the vth of the iiird.
(will have to check old hrly charts)
The iv is an irregular wave and marked so in alternation to wave ii . pl. check the structure of both.
EW being subjective has many valid alternatives put across by learned people. One should keep it objective and try to gauge the direction and structure of waves in combination with indicators.
Thanks RV for the clarification. I didn't think about the alternation. You are right second wave is simple and four wave should complex.
Please let me know which indicator or trading system work well with Elliot wave. I am not a intra trader/swing trader. I am using Elliot wave to predict to buy options strategy. Please guide.
meena
@Anonymous-
Though rule of alternation happens between wave 2 &4 but still its not a hard rule.
U can see my weekend analysis so as to how i corelate technicals with EW though there is no fail safe indicator for it.
Ur method of trading options with EW is quite risky and I can suggest u to take time study for each wave into consideration for taking bebefit of time decay component of options.
Generally one can write options in wave 2 and 4 and buy OTM options in 3 & 5 in direction of trend. More complex strategies can be employed so as to take advantage of trend with min. risk
Hi Aarvee,
Your long term wave count says we are in a flat. (It looks like you are projecting a rare running flat) There is also a descending triangle breakout around 5200. Dont triangles occur in the last but one stage of a move? The target for the triangle is closer to 4200 whereas if its a flat it has to go below 2500. Some explanations here
please?
Thanks,
Badri
@Badri ,
I request u to please go through the chart again .The long term EW count shown here from nov 2010 shows either a double zigzag or a zigzag (not a flat).
Though since 2008 it may be trading in a triangle which is in c wave (c-4),and yes its a 4th wave.(please check the link given of EW basic count.)
U are correct the triangle occurs normally in the 4th wave but its not a hard rule of EW. We have taken care that if this triangle is invalidated by closing above the top trendline ,then this EW count that I have been following is wrong and we may go to a new high.
Regards
Thanks for getting back Aarvee. So if you are marking Jan 08 high as 3 and Nov 09 low as A and Nov 10 high as B, and if we are in C isnt that a flat? I think I need to brush up my EW basics once again :) Any further clarification would be much appreciated.
Thanks,
Badri
oops, read March 09 low as A (not Nov 09 )
Badri.
@Anonymous ,
U didnt mention the details of the flat in yesterday's comment.and since I had posted a Nov 2010-till date chart ,i thought ur reference to it.
Ya the charts since 2008 have shown a flat (no need to brush up for that :)) till now, but as i elaborated ,i expect it to move in a triangle later as shown in d & e waves . My bias is not of a double dip to 2500 .
Thanks. The effort you are putting on your weekly updates needs a very special mention and its greatly appreciated.
Thanks once again,
Badri
Post a Comment