The cocktail of Volume profiles, Option Analysis , Indicators & EW did the trick again.
As analyzed the correction terminated in the first half with a new low (EW) , the positive diversion was maintained with new lows too (Indicators with positive diversion ) and as expected the bounce came in the second half (EW + exhausted Indicators). Nifty traded on both sides of 6000 with expiry above 6000 level (Option Analysis ),also expected in the Weekend post.The range was maintained with 5960 level and 6050 levels as extremes (Volume Profiles).
Also it was mentioned yesterday that last week open interest addition and specially last day ones are risky speculative trades ,normally dumb ,to be swallowed by smart money.Yesterday it was 6100 put writers which have been agressively adding in last three days ,today were 6000 call writers who were active since yesterday in huge quantity, that were butchered. Please remember this aspect when analyzing open interest and not get swayed in the positional trades by these expiry blues.
Going further ,6070 and 5930 level will play important role in deciding EW labelling and Nifty movement.
Hope U all had a great trading day .
Thursday, September 30, 2010
Wednesday, September 29, 2010
EOD
Nifty started trading below 6050 levels after opening ,giving indication of a downtrend day to unfold in line with yesterday's analysis.

As from last three days the weakness is below 6050 level and Important support at 5960 level.

Option Analysis shows that 6000 strike calls have exceeded puts ,showing difficulty in defending this level by bulls. ( Last day addition or as such in last week of expiry, large open interest addition in any strike is aggressive trade by speculative money, normally dumb ,as 6100 put writers showed in last three days.)
There is a slight positive diversion in indicators ,which if maintained will give a bounce.

EW count shows a clear corrective trading in last three days. Whatever the probable count , this short term correction seems to be over or may be by first half tomorrow ,then a bounce can be expected.Hourly indicators also look exhausted.

Range bound trade on both sides of 6000 level is expected for tomorrow.Trade light .
Tuesday, September 28, 2010
EOD
As indicated yesterday , bounce came near 6000 level .Now the structure of the market is showing weakness ,this may be a consolidation before further upmove or a larger correction setting in for the upmove since 5350.
2d and 5d Volume Profiles show similar traits as yesterday ,i.e., weakness below 6050 level and support at 5960 level.


Option Analysis shows support at 6000 level and resistance at 6100 level .It can be a rangebound last two days till expiry.
Posting an alternate EW count taking as completion of the 5th wave of this upmove since 5350 and setting in of larger ABC correction.


The message of the market is to book profit at each rise and aggresive shorts can be build up near recent top with strict s/l .
Monday, September 27, 2010
EOD
- 2d Volume Profile shows selling above 6050 level and support near 6000 level.

- 5d Volume Profile shows that today's selling was on lower volumes. It also emphasizes support near 6000 level .
Break of 5960 will signify weakness. This level can be treated as the SAR level for tomorrow's trade.

- As per the EW count the 5th wave is on.Today the third subwave of this 5th may have ended and we may be trading in the fourth subwave .Ideally this should not trade below the first subwave end at 5990 level ( but an ending diagonal scenario is an exception to this rule ,which occurs as a pattern in the 5th.) Lets see the price unfolding tomorrow .
- Apart from Volume Profiles ,the Option Analysis shows support at 6000 level, by addition at 6000 strike puts today ,now nearing approx. 90 lacs.
- Fibo retrace of the last leg of the upmove also has support at 6000 level.

- Most importantly in this FII driven rally ,they are buyers today also in excess of net 1000cr. ,signalling that it may be a pullback only rather than a start of the reversal.
So weakness below 6000 level and further upmove above 6050 level.Trade cautiously.
Sunday, September 26, 2010
Weekend Analysis
1. The 5d Volume Profile shows support at 5960 level. Trading below it will signal weakness.

2. The Option Analysis shows a build up of apprx. 86 lac O.I. in 6000 strike puts , indicating a strong support at 6000 level . It will be difficult to break this level till expiry & Nifty may expire above 6000 levels . Calls have max. buildup at 6100 level which will be immediate resistance level .Put writers have entered into 6100 strike aggresively in last trading session. Further buidup here will give indication of price level to unfold.
3. The probable EW count shows the completion of the 4th wave and trading in the 5th and final wave of this upmove since 5350 level. The 5th wave may be in its third subwave. The approx. target of the 5th wave , equating with the 1st wave of 165 points , is near 6100 levels. Though it may extend well beyond it. ( next target may be 6200 level if extends by 1.618 ). Booking out of longs near 6100 levels will be prudent ,and trading light thereafter .

The probable EW count of this upmove is as shown -

Thursday, September 23, 2010
EOD
As expected there is some correction/pullback in the 4th wave and it is probably in it's 'c' subwave . This wave may be in its last leg and ( if have not ended today ) can end in the first half of tomorrow's trading ,with the final wave, 5th, of this upmove unfolding.

5900 level looks like a good support from where a bounce for the next move up can be expected.
- 5d Volume Profile shows good support at 5890 level.
- Option Analysis shows 5900 strike puts having O.I. of apprx. 95 lacs giving good support. Even 6000 strike puts have somewhat larger O.I. than calls at same strike suggesting bullishness.
- Apprx. 5905 level is the 5d low ema and apprx. 5915 is 7dema , from where bounce can be expected.
-Volumes in today's fall were lower than volumes during previous trading days of upmove ,suggesting that this may only be a pullback before next upmove.

Monday, September 20, 2010
EOD
The 2d volume profile shows support at 5885 level. The Option Analysis and the 5d volume profile chart now indicate 5800 level as a strong support to this upmove for a pullback correction.

The EW count since 5350 has been revised as per the Alternate count (of chart 4 mentioned yesterday).The Third wave is on and in its vth subwave ,i.e. in the last leg ,after which a pullback can be expected to unfold in the Fourth wave.


The EW count since 5350 has been revised as per the Alternate count (of chart 4 mentioned yesterday).The Third wave is on and in its vth subwave ,i.e. in the last leg ,after which a pullback can be expected to unfold in the Fourth wave.

Saturday, September 18, 2010
Where Are The Markets Heading ???
The basics of the Elliot Wave Theory has helped me gauge the Market structure and have a probable path to trade the waves. I am posting my perspective of the markets since 2003 and have tried to divide it in lower time frames to link these waves to larger version for easy understanding. The supporting analysis of Volume profiles , Option open interest & Liquidty flow by FII’s, at major turning points (like at the end of August series near 5350) , helps in getting interpretation of the Wave to unfold. Similarly having alternative view of wave counts helps maintain the necessary flexibility required for trading.
CHART -1 (since 2003)
It shows a clear five wave upmove from 2003 till Jan 2008.After that the correction sets in larger A-B-C waves.The A wave ends in Oct 2008 in a downward five waves pattern.From there starts the B wave in a corrective three wave upmove .The subwaves 'a' and 'b' of this larger B ends at March 2009.


CHART -2 (since March 2009)
It shows the 'c' wave of the larger corrective B unfolding in five waves up.Probably this subwave 'c' is now in its fifth wave.


CHART -3 (since May 2010)
It shows the 5th wave of subwave 'c' starting from end of May 2010 ,near 4786 level, and moving up in five wave pattern. This also may be in the last leg of it's 5th wave.

CHART -4 (since Sept 2010)
This shows the 5th - 5th - c- B ,which started since 5350 levels.It may be in its 4th wave & 'b' subwave.

ALTERNATE COUNT :
This view takes Nifty to a new all time High rather than ending in a double top or below the previous high of Jan 2008 as would in a regular B.This view corelates with the Channel pattern (since Oct 2009) break giving target of 6300 + .


CHART -1 : The Larger B may be an irregular corrective which crosses the point of start of A .i.e. it goes above high of Jan 2008.
CHART- 2 : Instead of the 5th wave, it is the 5th subwave of the extended 3rd wave since March 2009.
CHART -3 : Remains the same.
CHART -4 : Instead of the 4th wave, it's the extended part of the 3rd wave continuing still.
Alternate count may be read as,
3rd (since 5350) - 5th (since May'10 ) - 3rd (since July'09) - c (since March'09) -B (since Oct '08).
Keep these charts handy for future short term swing and long term positional trading as the Markets show their hands.
Alternate count may be read as,
3rd (since 5350) - 5th (since May'10 ) - 3rd (since July'09) - c (since March'09) -B (since Oct '08).
Keep these charts handy for future short term swing and long term positional trading as the Markets show their hands.
Friday, September 17, 2010
EOD
As expected the 'b' corrective of the Fourth wave gave a bounce and traded flat for the day. Now the 'c' subwave of this Fourth may bring the market down to 5800 level. Expected area of the Fourth wave ending will be near 5775-5800 zone.Keep an eye on this zone to cover part shorts or go long for the Fifth wave up.

The 5d Volume Profile shows 5795 as the Important support area for the upmove to continue.


The 5d Volume Profile shows 5795 as the Important support area for the upmove to continue.

Thursday, September 16, 2010
EOD - 2
This is a follow up post on the Inverted Head & Shoulders patterns that were sighted in early July and brought to notice of the Group in a mail.Hope somebody kept an eye on it .(Dear Manu did !!! ).
1. In July, when the two Inv. H &S were seen ,the Bigger was about to be completed and prices were near 5350 level.The target for Smaller was 5580 level and that of the Bigger one was 5925 level. It was hard to believe it then !!!.

2. A post was done on 01/08/2010 here when very bearish views were being floated (in July) about August series.The above was mentioned as a contrarian view then.
http://o-j-n.blogspot.com/2010/08/antithesis.html
3. A followup post was done on the Pattern in a Weekend Analysis on 05/09/2010 ,when the upmove started.
http://o-j-n.blogspot.com/2010/09/nifty-technical-analysis.html

4. Again it was notified when the target of 5580 was reached for the Smaller pattern.
http://o-j-n.blogspot.com/2010/09/eod-ew-count.html
5. See what it looks like Today-

EOD -1
A pullback seen today,after the negative diversion indicated yesterday.
Now the 2d volume profile shows start of some short term correction (pull back/cooling off )

5d volume profile shows 5795 level as immediate support for this pullback.

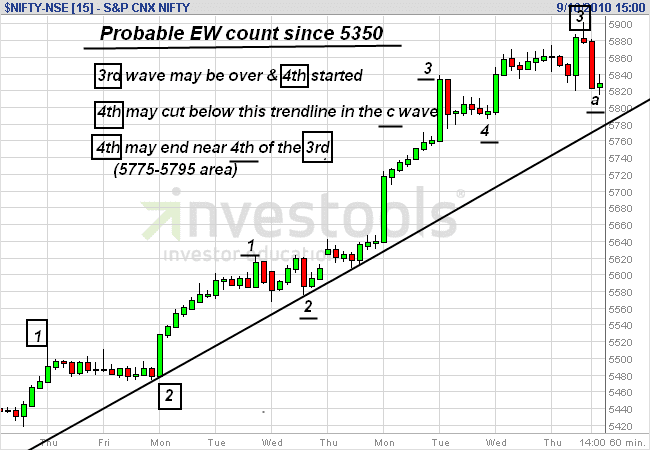
Probable EW count has helped much to ride these waves.The Third wave may have ended today and the Fourth corrective has started.Usually in a strong uptrend the Fourth wave may end somewhere near the fourth subwave of a lesser degree i.e 4th of the Third.The probable area for a bounce may be 5775-5795 region(it concurs with the 5d volume profile also ), starting the Fifth wave of this upmove since 5350.

.

Now the 2d volume profile shows start of some short term correction (pull back/cooling off )

5d volume profile shows 5795 level as immediate support for this pullback.

Probable EW count has helped much to ride these waves.The Third wave may have ended today and the Fourth corrective has started.Usually in a strong uptrend the Fourth wave may end somewhere near the fourth subwave of a lesser degree i.e 4th of the Third.The probable area for a bounce may be 5775-5795 region(it concurs with the 5d volume profile also ), starting the Fifth wave of this upmove since 5350.

.
Wednesday, September 15, 2010
EOD
The 2d and 5d Volume Profiles show support in short term at 5795 now !!!.


The 5d charts show negative diversions in last two days of trading ,may induce a pullback to the Trendline supporting the upmove.

Probable EW count - - -


The 5d charts show negative diversions in last two days of trading ,may induce a pullback to the Trendline supporting the upmove.

Probable EW count - - -

Tuesday, September 14, 2010
EOD
1. 2d Volume Profile shows support at 5760 levels,break of which can only bring larger correction.

2. Probable EW count indicates the end of the 3rd subwave of the Third wave of the upmove since 5350 and start of 4th subwave of the Third.The 4th may correct by apprx 38% of the total upmove in 3rd subwave ,giving the approx. target of 5750 ,this also concurs with the volume profile.The 4th subwave may end by tomorrow and the 5th subwave of this Third may start.Some what larger correction may occur only after completion of the Third wave of this upmove.


2. Probable EW count indicates the end of the 3rd subwave of the Third wave of the upmove since 5350 and start of 4th subwave of the Third.The 4th may correct by apprx 38% of the total upmove in 3rd subwave ,giving the approx. target of 5750 ,this also concurs with the volume profile.The 4th subwave may end by tomorrow and the 5th subwave of this Third may start.Some what larger correction may occur only after completion of the Third wave of this upmove.


Monday, September 13, 2010
EOD
Another Trending day.
The Volume Profile and the Trendline have served well in this upmove.


Had to relabel the subwaves of the third wave of this upmove-

The Option Analysis shows some interesting observations apart from the expected ones of covering of 5600 and 5700 calls and addition of 5700 puts.
Guess where the game has shifted ?? Which are the call and put strikes adding max. percentage wise open interest (not quantity wise)??
The max. % Call addition is at 5900 strike and that of Put is at 5800 strike !!!!!!!.
No good fighting the Trend.Ride the waves untill resolves in opposite direction
Saturday, September 11, 2010
Weekend Analysis
1. Indicators : The short term indicators show overbought zone of trading with negative diversion.

2.Volume Profile : The volume profile shows initial support for the upmove at 5595 level and major support for positional trading at 5490 level.

3.Trendline: Keep an eye on this trendline break for some correction in near future.

4.EW count: The probable EW count for the upmove since 5350 shows the 3rd wave is on
( with maybe some upmove left in the last leg,if not completed on thrusday ).This cautions us for some correction in the 4th wave that may not go down below 5515 level.

5.Option Analysis: As was indicated earlier, the range shifting has taken place from 5400-5600 at the start of the series to 5500-5700 in this week. Now the 5500 puts have O.I. of over one crore and 5700 calls have highest O.I. of call side above one crore.
6.Fibo -Retrace: If this upmove ends near here than the probable targets for the correction may be near 5575-5530 zone.It also concurs with the EW count and the Option Analysis.

Have a Great Weekend !!!!
Subscribe to:
Posts (Atom)