
The rally is now showing some signs of exhaustion in short term . Indicator diversions , candlestick formations , Pattern , Trendlines and Options data along with EW count probability are suggesting that a correction may set in.
The last comment Eod 04-10-12 suggested that of an EW probability of short term top arriving soon . Now further to it-
The 'freak ' trade in Nifty Spot in last session has skewed its charts and indicators. Below are the Nifty Futures charts along with comments but the values mentioned are for Nifty Spot.
1. Weekly Chart :

2. Daily Chart:

3. Hourly Chart:

4. Options Data:

5. Fibonacci Retrace:
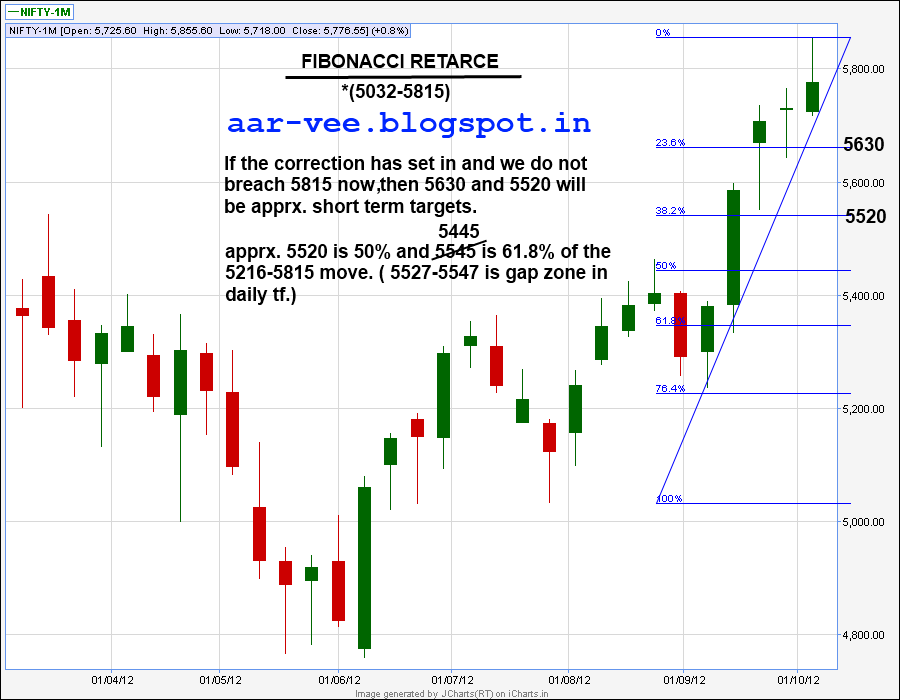
So a probability that a short term top is in at 5815 is strong. The above counts invalidates on cross of it. The likely immediate targets below are apprx. 5630-5520.
In case we move above 5815 then apprx. 5870 ( C=A) and 6000 ( wave3=1.68Xwave 1) are likely targets.
Have a Profitable Week ahead !!!
9 comments:
Its so simple and precise analysis's usual and always keep it up sir.
Regards
Dear RV!
Wowwwwwww, if your studies hinting short term possible top then chances are good for bears. Very good unbiased analysis as usual, keep continue good work.
Thanks RV, God bless you
thanks for sharing,your valuable counts and charts
Thanks AAR VEE sir, for your unbiased views & wonderful charts :)
good analysis rv
Great analysis and crispy charts as usual.
Sincere Thanks to
KP singh,Kumarji,Anonymous,mk,SP ,Piyush and Karthikg for leaving ur comments.
EOD 8-10-12
------------
*small correction in fibonacci charts above done that of retrace range mentioned as 5032-5815 and typo of 5445 value corrected.
Following were the observations of todays trade.
- Imp. level as mentioned in previous posts and comments that of 5730 was voilated in inital trading and prices held below it suggesting weakness.
- Fall was on comparitively low volumes and small reduction in NF O.I suggesting confidence (or is it overconfidence ?) of Long Positions.
- 5700PE gave way and unwinding observed whereas 5700CE saw addition. Max O.I. build up at Puts is now at 5600 strike.
- 5300 puts saw max unwinding that of apprx 8.5 lacs (apprx 20%). Is such an unwinding at far away strike some signal of things to come in near future?
- Now the zone of 5715-5730 is a potential resistance area.5650 is a previous gap fill level and 5630-10 is an immediate support zone.
- Its a sell on rise market in short term till closes above 5760 now.
What we may witness over the next few weeks could surprise many with huge volatility swings either way leaving most holding their breadth.a move down to 5450 to 5550 today or over the next few days could set the tone for climax next week. In all probability one can buy and hold nifty around 5500 to 5450 and then hold for 5850 to 5900 over the next week or so.please do your own due diligence as this is not a trading advise and market moves over the next few days would take even the best hedge fund manAgers by surprise.i could be 100 percent wrong in my view.
Post a Comment