Friday, November 26, 2010


Date : 'JANUARY 2011

The Posts till date in this Blog Archives were  published at OJN2 
http://o-j-n.blogspot.com/ ), a blog where friends used to share their trading ideas.
-------------------------------------------------------------------------------------------------------------

Sunday, November 21, 2010

Weekend Analysis

Lets look what's in store for next week after swift correction since last ten trading sessions.

1. Indicators :

Daily indicators are reaching oversold zone but are yet to exhaust where as Weekly indicators have starting to come off the long overbought zone and indicating sell signal.
So, looks like some pain may be left before bottoming out happens .
(But remember last three corrections in the channel trading since Oct 09 ,reversals have been swift ,V shaped ,and with no positive diversions of notice. )


2. Volume Profile :

The short term 5d volume profile shows that the reversal will come in shortterm only if closes and sustains above 5990 -6000 level .It is also emphasized by the Weekly MP charts (courtsy- Mok) showing the value shifting lower in last four weeks and the last week's POC at 6006 level.
We can guess a reversal in shortterm on Price & Volume basis at a close above 6000 levels. 


3. Few Charts :

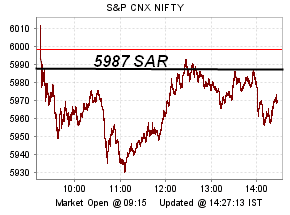
The Closing Price chart shows the last low close of 5987 was broken on Friday.This level of 5975-90 has been a good support area lately.It is likely to become a Resistance zone till the reversal of trend closes the prices above it.


Check out the trading in the Long term chart and draw a Trendline . The support is near 5750 level or nearby.


Nifty has been trading in a Channel pattern in  Medium term (since Oct 09) till the recent breakout couple of months ago .It seems to pull back to the Channel Topline to retest the supports.This will also come near 5700 levels.


The Moving Averages charts shows that the prices have closed below 50dma support.They are likely to test 100dma support near 5750 level. Also the 50,100,200 dma's are bullishly aligned indicating the long term bullish trend is intact and its a pullback in shorter time frame.


A Combination chart of the Fibonacci level charts since the pivot level of 4786 and 5350 along with 100 dma and the Trendline shows a important confluence price area of 5725-5750 level.


The Volume Profile,MP chart and Closing price chart shows 5990-6000 level as Resistance and rest of the charts show 5725-50 as Support area ( if trades below last day low,5860 ) 

4. Option Analysis :

The maximum O.I. on Call side remains at 6300 strike whereas the Put side max. O.I. has shifted to 5900 strike after 6000 level gave way last week showing bearish undertone. The 6000 strike calls are exceeding the 6000 puts where as 5900 puts are exceeding similar call strike indicating resistance at 6000 level and support at 5900 level. There has been aggresive call writing at 5900 strike after 5935 level gave way in last trading session ,it may be indication of things to come .
As of now it indicates a range trading between 5900 and 6000 levels with downward bias.

5. EW Analysis:

Since 5935 has been taken count ,we take into consideration the Alternate count by which its a continuation of the A-B-C correction and we are trading C Wave of this correction since 5350 .

The calculation and notes for the 'C' wave are given in the chart and we seemed to have achieved it at last low of 5860 level.

The above target is as per theory but in practice the C wave tends to extend the theoritical target at times.
Also this A-B-C correction will be the 4th wave since 4786 .The 4th wave generally breaks the trendline and gives a whipsaw.Since trading near the trendline (see the combination chart above )if gives such a whipsaw ,than the next higher low above the trendline will also be a sign of reversal .


so the Trading Mantra this week should be-

If 5725-50 zone comes in first half of the week ,book the shorts and than stay neutral till expiry.

If bounces from here in first half , go short with s/l of 6000 level on closing basis / (Trim longs), till expiry and part book at 5850 level and part below. (One may also look to buy 5900 /5800 puts in this case (small qty ) and trade the levels or write 6000calls.)

The week will be volatile and may trade both ways above and below 5900 levels. Pl be strict in using stoploss.

Friday, November 19, 2010

EOD & Weekly Review

Please recheck the Weekender Post.
http://o-j-n.blogspot.com/2010/11/weekend-analysis.html

 It was indicating a clear downward bias. 6120 as SAR served well since the start of the week http://o-j-n.blogspot.com/2010/11/eod.html
and probable modest target of c-4 nearing 5850 levels almost achieved. and break of 5935 resulting in swift downmove (today's second half) was indicated yesterday EOD with reasons for the false bounce.
http://o-j-n.blogspot.com/2010/11/eod-notes.html


The bottom should not be called in a hurry , Indicators ditch, Diversions don't comply ,Wave counts go wrong, Fibo supports dont hold. It's better to enter for reverse trade after confirmations in higher time frames and corelations of TA signals.Such a confluence of signals was mentioned in midweek updated charts where fibo support, EW count of c-4,Trendline and 100dma are nearly converging (5750-5800).
 http://o-j-n.blogspot.com/2010/11/update.html

Watch out for this zone and price action here for any bottoming out .Till then trade with trend or remain neutral.

Kya Picture Abhi Baki Hai ???

Intraday Update


Intraday

Check out yesterdays EOD Notes-

http://o-j-n.blogspot.com/2010/11/eod-notes.html


Thursday, November 18, 2010

EOD Notes

- I am not convinced about the pullback today.

- Not expecting any 'V' shaped recovery till expiry.

- Looks more like a short covering rally with low volumes at bottom emphasized by  
Nifty & Options open interest analysis.

- FII sold net 450 cr +

- Will look at long side scenario only on close above 6100 level.

- Posting a chart showing a simple method to trade tomorrow. Further keep in mind  the resistance zone of 6050-75.

- Expect a volatile trading day ahead and be cautious in the second half of the session.


$USD Action


                                    Check out the updated charts at

Wednesday, November 17, 2010

Tuesday, November 16, 2010

EOD

Hope someone was following the Weekend Analysis.

http://o-j-n.blogspot.com/2010/11/weekend-analysis.html

Please check it out again ,as may help in further trading.

Below is a chart for last two days of trading.


Will post some update tomorrow---------

Sunday, November 14, 2010

Weekend Analysis

We are poised at an important juncture for positional trades. Had booked longs near 6225 and above. 
 http://o-j-n.blogspot.com/2010/11/04102010.html

Now the last week’s action has created a crossroad ,so positions have to be taken cautiously.

1. Indicators:
The Weekly indicators have started coming off the OverBought zone after a long time ,The medium term Daily indicators are already nearing midway from OverBought zone downwards and the short term Daily are nearing OverSold areas.The Hourly Indicators have reached Oversold zone already.

There is a good probability of a bounce from here any time soon ,but be cautious to enter new longs ,either book old longs or wait on side lines.The quality of this bounce will decide the future course.

Since the higher TF indicators have started trending down ,there is a scope for a bigger correction before next upmove.

2. Volume Profile:
 There is clear indication of Positional selling near the recent top and till it is not taken out ,any bounce will remain a suspect.

Positional longs should be formed only on closing above 6290 level. 6120 level may be immediate resistance for any bounce. One can trade long above it and short below it.(This may give one or two whipsaws but trading it will be fruitful in the end and will cut all the noise)


3. Option Analysis:
 The maximum Call side buildup is at 6300 strike and that of Puts is at 6000 strike ( in which the call side is exceeding the put side ,showing Resistance and downward bias.)
 Aggressive built up at 6100 & 6200 calls after breaking 6200 levels shows bias for more downside.The 6000 puts stand firm in last week’s correction with no unwinding, shows immediate support level.

 First half of the week may see the 6000 level holding.The trading range may be 6000-6300 with downward bias.


4. FII Activity:
Frankly I was not anticipating this sell off seeing the PreDiwali buying of 5475 Cr. !!! on a single day (4/11/10) and 6120 being the 10d highest volume level from where this breakout gathered steam,(was expecting this level to hold on Friday) But FII’s have turned sellers in last three trading sessions which also cautions us as this selling for three consecutive sessions comes after a long time.

5. EW count:
 As per the last EW update ,the probability of the start of the 5th wave since 4786 level was taken into account. As mentioned this count is valid till 5935 holds. Pl. check
http://o-j-n.blogspot.com/2010/10/weekend-analysis_31.html

 Now if 5935 holds this correction may be only the 2nd of the 5th and upward journey will resume (Ending Diagonal Scenario???). But if this level gives way ,the Alternate count suggests that this may be the 'c' wave of the 4th which can target 5800 levels or below.


Trade with caution.

Keep in mind the 5935 level. Down move below it will be fast.

Positional longs only on closing above 6290 level.

6120 can be the SAR level for this week’s trading.


Saturday, November 13, 2010

The Road Not Taken

Posting Poems which will take us through the age old wisdom of Life.


 Today's Poem is by Robert Frost titled - "The Road Not Taken"


Two roads diverged in a yellow wood,

And sorry I could not travel both

And be one traveler, long I stood

And looked down one as far as I could

To where it bent in the undergrowth;

Then took the other, as just as fair,

And having perhaps the better claim,

Because it was grassy and wanted wear;

Though as for that the passing there

Had worn them really about the same,

And both that morning equally lay

In leaves no step had trodden black.

Oh, I kept the first for another day!

Yet knowing how way leads on to way,

I doubted if I should ever come back.

I shall be telling this with a sigh

Somewhere ages and ages hence:

Two roads diverged in a wood, and I—

I took the one less traveled by,

And that has made all the difference.

Thursday, November 4, 2010

04.11.2010

Hi All ,
Good Morning,

Pl. go through the weekend analysis -
http://o-j-n.blogspot.com/2010/10/weekend-analysis_31.html

Taking some profits off the table as desired target near 6225 levels have been reached.
Remember it was the level where the 3rd wave since 4786 ended. Indicators being overbought also are a pointer for booking some profit.

Further bullishness may persist ,so dont be short positionally.

Have a nice day.
Share
Subscribe