Detailed Technical Analysis and Trading Strategy for the Next Week -
1. Indicators:
The Hourly chart has Oversold Indicators ,where as the Daily have given the Sell signal. There may be a bounce initially and then be dictated by Daily indicators towards weakness.
2. Moving Averages :
The Shorterm MA 5-20 ema as well as the Longterm 50-200 dma are Bearishly aligned.
The last close was below the Weekly 5ema as well as Daily Low 5ema ,indicating weakness in both Daily and Weekly TF. One should keep in mind that the close was also below Monthly Low 5ema.
Now Some strength if trades above Weekly 5ema at 5430 and Reversal only above Monthly 5ema at 5535 level. More Weakness below Weekly Low ema at 5360 level.
3. Trendlines and Patterns :
The Medium Term Trendline has been providing Resistance in trading since Feb. Another attempt to Breakout above it has failed.
The Hourly chart have formed a Descending Triangle which has been broken and may target 5260 level below 5420 now.
The Hourly and Daily are travelling within Channels , Both have Lower Trendline Support near 5300 levels.
4. Volume Profiles :
The strength will come on trading above 5450 level as evident in the 2day Profile.
The Reversal in Short term will only be above 5510 level as suggested by 10d Profile.
5. Option Analysis :
The Highest Open Interest at any strike on both sides is at 5500 Calls ( last week was at 5400 Puts) suggesting a change in the likely Trend now, with 5500 acting as Resistance.
The Max. O.I. at Put side is at 5300 strike suggesting a range of 5300-5500.
Interestingly the 5400 Calls saw largest addition of O.I. at any strike on last trading day.This may be an indication of things to come this week as 5400 apprx is also the Max. Pain level .
6. EW Analysis :
Please check the EW Post on Short term Probabilities- CLICK HERE
The likehood of the completion of the 4th wave (as have been resisted at 61.8% of the 3rd wave ) and the start of the 5th has increased.
7. FII Action :
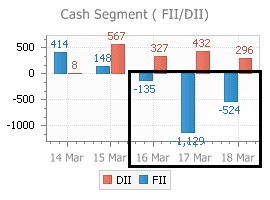
The FII's have again turned sellers and were net negative in last three days of trade .Also they have now turned net negative for the month of March.
Summing up the data above , the Trading Strategy for this Week may be -
1. The likely bias of the Week is Bearish.
2. There may be bounce to 5420-30 level which may be used in shorting again . If goes to 5300 level in first couple of days then book out shorts.( Review here)
3. Weekly trades can be managed with SAR of 5450 level initially.
(for whipsaws/reversal)
4. Below Last trading low /5360 level, the Target may be near 5300 level (Profit booking here) . Break of which will bring 5260 apprx and and levels below.(Review here)
5. Strength will be above 5510 level . Positional longs only above 5535 now.
Always remember the Trading motto to cut the Losses short and let Profits run.


6 comments:
Hi dear Aaa Ree,
Volume Profiles chart level (5450)are cash or fut.?
regards,
Alpesh
Hi Alpesh,
The Volume profile charts from 'volumedigger' site is provided by google finance.It's always spot.
Hi
Long time itching.. couldn't resist today - How long(in hrs??) u r taking for this excellent analysis?? that too in a simple manner , any layman can trade with your levels.
Hi Sujatha
Definetly less than the 'Super woman' putting it for kitchen and family :))
Key is the money and risk management to trade with this analysis.
Thx Aar Vee, for reply
where this volume porfile chart see? plz give me link
regards,
Alpesh
Alpesh,
Please read my answer to Avinash in the next post.
Post a Comment