Since the start of the Month ,Nifty is trading in a range of broadly 6000-6200 and in an Expanding triangle Pattern. This is the correction/consolidation phase after the big upmove from 5350 levels of 900+ points . Coming up is the expiry week for this series and hopefully this phase gets over by next weekend.
Important Levels :
Seeing the 10d Volume Profile ,The Resistances are at apprx. 6090,6120,6185 levels and Supports at 6020,5965 levels.
The Fibonacci Retrace levles from 4786 to 6285 ( marked in blue) and that of 5350-6285
(marked in red) show important confluence levels at 5930 and 5820 levels which are also previous important Pivot levels.This phase can end at these levels if it trades below 6000 now.
Indicators :
The Short term Daily Indicators have risen up from oversold levels and can dip again from neutral levels.
The Medium term Daily Indicators are yet to exhaust in the oversold zone ,indicating some more downside.
O.I. & Rollover :
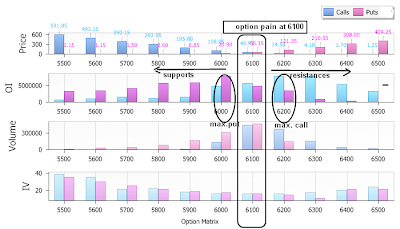
The max. Call side O.I. is at 6200 strike (apprx.79 lacs) and that of Put is at 6000 strike (apprx.77lacs).This has almost been maintained throughout the month but has an important change this week,
-The O.I. at 6200CE has exceeded 6000PE for the first time in this month,
-There has been decrease in O.I.at 6000PE from apprx. 85 lacs to apprx. 77 lacs this week,
-The O.I. of 6100 calls exceeded the puts at same strike.
-Futures O.I. also indicates closure of longs and lower rollover than last month.
All these indicates a bearish undertone and increasing probability of 6000 levels to give way.
The Max. Option Pain is nearer to 6100 levels now ,though this data is subject to change, the likely expiry can be at 6100 +/- 20 levels as of now.
Check the charts at Mok's post on options for further details-
http://o-j-n.blogspot.com/2010/10/weekend-of-charts-options.html
FII ‘s have been buyers all days in this week and net buyers throughout the month.They are accumulating at lower levels in this correction.
The EW count update of this sideways correction is giving more than one valid alternative.But my preferable count of 5th wave over and this correction being A-B-C of the upmove since 5350, points to correction reaching 5900 levels and below,before the next move starts in the intermediate upmove since 4786 level.
So the broader range trading range this week may remain the same ,6000-6200, but with Bearish probability of trade below 6000 levels. Major Supports come at 6020, 5935 and 5820 levels and resistances at 6090, 6120,6185 levels
Trade Light this week as the trade will be volatile due to pending rollover .


2 comments:
Hi RV,
so the range belts down, and remains sideways ...
Thanks, the newer charts are pretty well easy to take a fix on where we go.
FII buy has folded back, though very steadily positive.
Lets see.
Hey manu, the post is here ... :D
Thank you AAR VEE, very simple and clear view.
Post a Comment